Greetings! As an experienced forex trader, I understand that getting started in the world of forex trading can be overwhelming, especially for new traders. One crucial skill that every trader needs to develop is the ability to analyze forex charts effectively. In this simplified guide, I will walk you through the basics of forex chart analysis, empowering you to unlock the potential of the markets.
Forex trading charts are powerful tools that provide a visual representation of a currency pair’s price over time. By studying these charts, traders can analyze price movements, identify patterns, and spot potential trading opportunities. Whether you are a beginner or have some experience in trading, mastering the art of chart analysis is a crucial step towards becoming a successful trader.
Key Takeaways:
- Forex chart analysis is essential for new traders to understand market trends and make informed trading decisions.
- There are different types of price charts, including line charts, bar charts, and candlestick charts, each providing unique insights into price behavior.
- Reading and interpreting forex charts involves understanding elements such as opening and closing prices, highs and lows, and price patterns.
- Candlestick charting is a popular method of forex analysis, offering valuable insights into market sentiment and potential turning points.
- Live forex charts provide real-time market insights, allowing traders to make informed decisions based on the latest price action.
Types of Price Charts in Forex Trading
When it comes to analyzing price movements in forex trading, there are different types of charts that traders can use. Each type of chart offers unique insights into the market, allowing traders to make informed decisions based on price behavior. The three main types of price charts used in forex trading are:
1. Line Chart:
A line chart is a simple and straightforward way to represent price movements over time. It shows the closing prices of a currency pair, allowing traders to understand the overall trend. Here’s an example of a line chart:
2. Bar Chart:
A bar chart provides more detailed information compared to a line chart. It displays the opening, closing, highest, and lowest prices of a currency pair over a specific period. Traders can analyze the range between the highest and lowest prices, as well as the relationship between the opening and closing prices. Here’s an example of a bar chart:
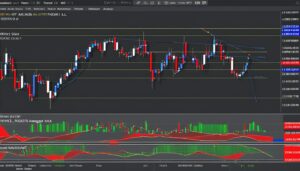
3. Candlestick Chart:
Candlestick charts are visually appealing and widely used by forex traders. They provide the same price information as bar charts but present it in a more visually intuitive way. Candlestick charts use color-coded candlesticks to represent price rises and falls. Each candlestick represents a specific time period and provides valuable insights into market sentiment. Here’s an example of a candlestick chart:
Each type of chart has its own advantages and disadvantages. Traders should choose the chart that best suits their preferences and trading strategies. Now that we’ve explored the different types of price charts, let’s move on to learning how to read and interpret these charts in Section 3.
How to Read and Interpret Forex Charts
When it comes to forex trading, being able to read and interpret charts is a crucial skill for traders. By understanding the various elements shown on the charts, traders can gain valuable insights into price movements and make informed trading decisions. Here’s a breakdown of the key elements and techniques involved in reading and interpreting forex charts.
Opening and Closing Prices
The opening and closing prices of currency pairs are fundamental pieces of information displayed on forex charts. These prices represent the starting and ending points for a specific period of time, such as a day, week, or month. By analyzing the relationship between opening and closing prices, traders can identify whether the market has experienced an upward or downward movement, indicating bullish or bearish sentiment.
Highs and Lows
Forex charts also provide data on the highest and lowest prices reached during a given period. These highs and lows help traders identify the overall range within which the price has fluctuated. They can also provide insights into potential support and resistance levels, which are significant price levels at which the market tends to reverse or consolidate.
Patterns and Price Movements
Patterns formed by price movements are valuable indicators for traders. These patterns can provide clues about future price behavior and potential trading opportunities. One popular type of chart used for identifying patterns is the candlestick chart, which visually represents price rises and falls through color-coded candlesticks. By analyzing these patterns and price movements, traders can identify trends, reversals, and potential entry or exit points for their trades.
“Chart analysis is like a detective work. Traders need to observe and decode the clues provided by the charts to make sense of the market dynamics.”
Utilizing Candlestick Charts
Candlestick charts are highly popular among traders due to their visual appeal and ability to provide detailed insights into price behavior. Each candlestick represents a specific time period, and the body of the candlestick indicates the opening and closing prices. The color of the candlestick (typically green or red) represents whether the price has risen or fallen during that time period. Candlestick charts often display patterns, such as doji, hammer, and engulfing patterns, that traders can use to predict future price movements.
For example, an engulfing pattern where a bullish candlestick completely engulfs the previous bearish candlestick may indicate a potential trend reversal from a downtrend to an uptrend. By understanding these patterns and their implications, traders can make more accurate trading decisions.
To successfully interpret forex charts, it’s important for traders to understand the elements displayed, such as opening and closing prices, highs and lows, and patterns formed by price movements. Candlestick charts are particularly useful for identifying trends and potential market reversals. By analyzing these charts, traders can gain valuable insights and make more informed trading decisions.

Benefits of Candlestick Charting in Forex Analysis
Candlestick charting is widely recognized as an effective tool for analyzing price movements in the forex market. With their unique visual representation and ability to identify market turning points, candlestick charts offer valuable insights for traders. Let’s explore the benefits of using candlestick charts in forex analysis:
1. Comprehensive Representation of Price Movements
Candlestick charts provide a comprehensive view of price movements, displaying not only opening and closing prices but also the highs and lows of each trading session. This information helps traders understand the range and volatility of a currency pair, enabling them to make informed trading decisions.
2. Identification of Chart Patterns
Candlestick patterns, such as doji, hammer, and engulfing patterns, have unique names and can be easily recognized on candlestick charts. These patterns often indicate market turning points, signaling potential reversals from uptrends to downtrends or vice versa. By identifying and interpreting these chart patterns, traders can anticipate market movements and take advantage of profitable trading opportunities.
3. Visualization and Clarity
Candlestick charts are visually appealing and provide a clear representation of price movements. The color-coded candlesticks make it easy to differentiate between bullish (green or white) and bearish (red or black) sentiment. This visual clarity enhances the understanding of market dynamics, allowing traders to quickly interpret trends and patterns.
4. Adaptability to Visual Learning
Candlestick charts are especially suitable for visual learners as they rely on visual patterns and cues. Traders can easily identify bullish and bearish candlestick formations, trendlines, and support and resistance levels. This adaptability to various learning styles makes candlestick charting a preferred choice for many forex traders.
5. Versatility in Timeframes
Candlestick charts can be used effectively on various timeframes, from intraday trading to long-term investing. Traders can analyze candlestick patterns and market trends on different time intervals, such as hourly, daily, weekly, or monthly charts. This versatility allows traders to adapt their strategies to different trading styles and timeframes.
Overall, candlestick charting is a powerful tool for forex analysis, offering valuable insights into market dynamics, chart patterns, and potential market turning points. Traders can leverage the visual clarity and interpretive nature of candlestick charts to make informed trading decisions and enhance their overall trading performance.
Live Forex Charts for Real-Time Market Insights
When it comes to trading in the forex market, having access to live forex charts is crucial for making informed decisions. These charts provide real-time insights into price action, allowing traders to analyze market movements as they happen. By monitoring live forex charts, traders can stay updated on the latest market trends and identify potential trading opportunities.
There are numerous online platforms that offer free live forex charts for a wide range of assets, including currency pairs, precious metals, oil, cryptocurrencies, stocks, and stock market indexes. These platforms provide real-time price data, allowing traders to track price changes and fluctuations in the market.
With live forex charts, traders can set their personal preferences and customize the display to suit their trading strategies. They can choose the timeframes that best match their trading style, whether it’s short-term scalping or long-term investing. Additionally, traders can use technical analysis tools available on these platforms to further enhance their market analysis.
One of the significant advantages of using live forex charts is the ability to analyze historical data. Traders can access historical price information and study past trends and patterns to gain valuable insights into future market movements. This historical analysis can help traders identify recurring patterns, support and resistance levels, and other crucial factors that can influence trading decisions.
“Live forex charts provide traders with real-time information and insights into the market. By closely monitoring price action and analyzing historical data, traders can gain a deeper understanding of market trends and make more informed trading decisions.”
By utilizing live forex charts, traders can effectively conduct market analysis and develop their trading strategies based on real-time information. Whether you are a beginner or an experienced trader, incorporating live forex charts into your trading routine can significantly improve your decision-making process and enhance your trading performance.
Live Forex Chart Example:
| Date | EUR/USD | GBP/USD | USD/JPY |
|---|---|---|---|
| 2021-01-01 | 1.2256 | 1.3724 | 103.25 |
| 2021-01-02 | 1.2301 | 1.3709 | 103.10 |
| 2021-01-03 | 1.2355 | 1.3750 | 103.15 |

Conclusion
Understanding forex chart analysis is essential for new traders looking to unlock the potential of the markets. By mastering the skills to read and interpret different types of charts, traders can gain valuable insights into price behavior, trends, and market dynamics. This simplified guide to forex chart analysis provides new traders with the necessary knowledge to make informed trading decisions.
Candlestick charting, in particular, is a powerful tool that helps traders analyze market sentiment and identify potential market turning points. The visual representation of price rises and falls through color-coded candlesticks offers a clear and intuitive way to assess market conditions. By recognizing chart patterns and understanding their meanings, traders can spot opportunities and time their trades effectively.
Live forex charts further enhance traders’ decision-making process by providing real-time updates on price action. These charts enable traders to stay informed about market movements as they happen, ensuring they are up-to-date and can make well-informed trading decisions based on the latest information available. Whether it’s monitoring price changes, setting personal preferences, or analyzing historical data, live forex charts are an invaluable resource for traders.
Start your forex chart analysis journey today and enhance your trading skills. With a solid understanding of chart analysis, new traders can navigate the markets with confidence and optimize their trading strategies. Remember, the key to successful trading lies in gaining insights from forex charts and using this knowledge to make informed trading decisions.
FAQ
What are forex trading charts?
Forex trading charts are visual representations of currency pairs’ prices over time, helping traders analyze movements, patterns, and tendencies in the market.
What are the different types of price charts used in forex trading?
The different types of price charts used in forex trading include line charts, bar charts, and candlestick charts, each providing unique insights into price behavior.
How do I read and interpret forex charts?
To read and interpret forex charts, traders need to understand the various elements shown, including opening and closing prices, highs and lows, and patterns formed by the price movements.
What are the advantages of candlestick charting in forex analysis?
Candlestick charting in forex analysis offers a powerful tool for analyzing market sentiment and identifying market turning points. Candlestick patterns have unique names and help traders remember their meanings.
Where can I find live forex charts for real-time market insights?
Traders can access various online platforms that offer free live forex charts for different currency pairs, precious metals, oil, cryptocurrencies, stocks, and stock market indexes.
Why is understanding forex chart analysis important for new traders?
Understanding forex chart analysis is essential for new traders to unlock the potential of the markets. It allows traders to gain valuable insights into price behavior, trends, and market dynamics.
Source Links
- https://www.babypips.com/learn/forex/types-of-charts
- https://www.ig.com/en/trading-strategies/how-to-read-forex-charts-200720
- https://www.litefinance.org/blog/for-beginners/types-of-forex-charts/
Disclaimer
All information on this website is of a general nature. The information is not adapted to conditions that are specific to your person or entity. The information provided can not be considered as personal, professional or legal advice or investment advice to the user.
This website and all information is intended for educational purposes only and does not give financial advice. Signal Mastermind Signals is not a service to provide legal and financial advice; any information provided here is only the personal opinion of the author (not advice or financial advice in any sense, and in the sense of any act, ordinance or law of any country) and must not be used for financial activities. Signal Mastermind Signals does not offer, operate or provide financial, brokerage, commercial or investment services and is not a financial advisor. Rather, Signal Mastermind Signals is an educational site and a platform for exchanging Forex information. Whenever information is disclosed, whether express or implied, about profit or revenue, it is not a guarantee. No method or trading system ensures that it will generate a profit, so always remember that trade can lead to a loss. Trading responsibility, whether resulting in profits or losses, is yours and you must agree not to hold Signal Mastermind Signals or other information providers that are responsible in any way whatsoever. The use of the system means that the user accepts Disclaimer and Terms of Use.
Signal Mastermind Signals is not represented as a registered investment consultant or brokerage dealer nor offers to buy or sell any of the financial instruments mentioned in the service offered.
While Signal Mastermind Signals believes that the content provided is accurate, there are no explicit or implied warranties of accuracy. The information provided is believed to be reliable; Signal Mastermind Signals does not guarantee the accuracy or completeness of the information provided. Third parties refer to Signal Mastermind Signals to provide technology and information if a third party fails, and then there is a risk that the information may be delayed or not delivered at all.
All information and comments contained on this website, including but not limited to, opinions, analyzes, news, prices, research, and general, do not constitute investment advice or an invitation to buy or sell any type of instrument. Signal Mastermind Signals assumes no responsibility for any loss or damage that may result, directly or indirectly, from the use or dependence on such information.
All information contained on this web site is a personal opinion or belief of the author. None of these data is a recommendation or financial advice in any sense, also within the meaning of any commercial act or law. Writers, publishers and affiliates of Signal Mastermind Signals are not responsible for your trading in any way.
The information and opinions contained in the site are provided for information only and for educational reasons, should never be considered as direct or indirect advice to open a trading account and / or invest money in Forex trading with any Forex company . Signal Mastermind Signals assumes no responsibility for any decisions taken by the user to create a merchant account with any of the brokers listed on this website. Anyone who decides to set up a trading account or use the services, free of charge or paid, to any of the Broker companies mentioned on this website, bears full responsibility for their actions.
Any institution that offers a service and is listed on this website, including forex brokers, financial companies and other institutions, is present only for informational purposes. All ratings, ratings, banners, reviews, or other information found for any of the above-mentioned institutions are provided in a strictly objective manner and according to the best possible reflection of the materials on the official website of the company.
Forex/CFD trading is potentially high risk and may not be suitable for all investors. The high level of leverage can work both for and against traders. Before each Forex/CFD investment, you should carefully consider your goals, past experience and risk level. The opinions and data contained on this site should not be considered as suggestions or advice for the sale or purchase of currency or other instruments. Past results do not show or guarantee future results.
Neither Signal Mastermind Signals nor its affiliates ensure the accuracy of the content provided on this Site. You explicitly agree that viewing, visiting or using this website is at your own risk.